In today’s housing market, there are far more buyers looking for homes than sellers listing their houses. Based on the concept of supply and demand, this means home prices will naturally rise. Why is that? When there are more people trying to buy an item than there are making that item available for sale, that drives prices up. And that’s exactly the case in today’s housing market. So, knowing what’s happening with the inventory of homes for sale and the demand for housing is crucial for today’s buyers and sellers.
Nationally, Demand Is High and Supply Is Very Low
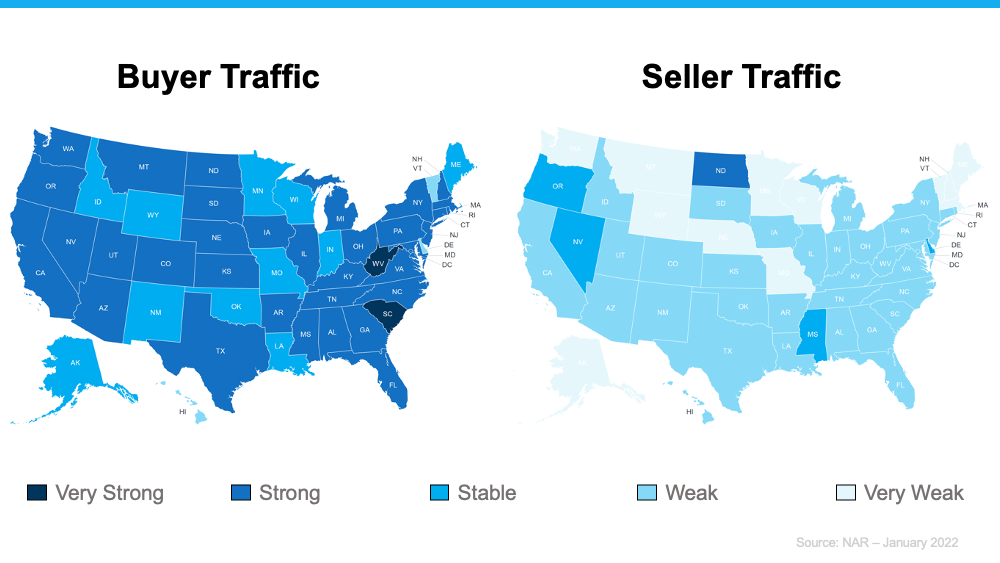
The latest buyer and seller activity data from the National Association of Realtors (NAR) indicates buyer traffic heavily outweighs seller traffic today, as shown in the maps below. There are far darker blues (strong buyer activity) on the left and much lighter blues (weak seller activity) on the right. In other words, this shows how the demand for homes is significantly greater than what’s available to purchase.
What Does This Mean if You’re a Seller?
Supply is struggling to keep pace with demand. In fact, the inventory of homes for sale recently hit an all-time low. That gives you an incredible advantage when you sell your house. With so few listings, it’s likely more potential buyers will view your house – especially if you work with an agent to price it right. That means there’s a high chance you’ll receive multiple offers or buyers will enter a bidding war for your house. And that dynamic can drive the sale price of your home up.
What Does This Mean if You’re a Buyer?
As a buyer with fewer options available, you’re likely to see more competition, so you need to be strategic to win. First, make sure you have a trusted professional on your side. Your real estate agent will help you understand your local market and work with you to act quickly when the time is right. Even when it’s challenging to find a home, you can still succeed as a buyer today if you have a trusted advisor on your side every step of the way.
Bottom Line
Whether you’re a homebuyer, seller, or both, knowledge truly is power. Let’s connect today so you can better understand what’s happening in our local market and achieve your homebuying and selling goals this year.
New Year Brings Continued Growth for Central Indiana Residential Real Estate Market
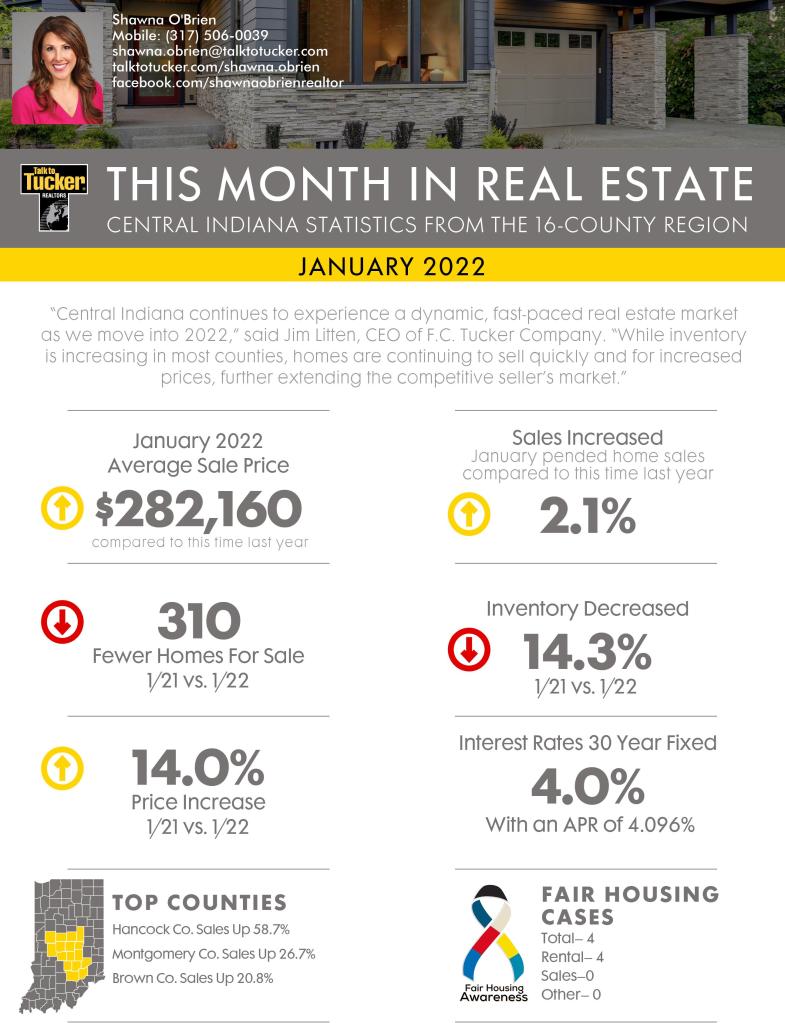
January 2022 continues 2021’s trend toward a robust residential real estate market. Monthly real estate statistics from F.C. Tucker Company revealed that January 2022 pended home sales decreased 2.1 percent compared to January 2021.
Year-to-date home sale prices increased 14 percent, and central Indiana housing inventory decreased 12.4 percent compared to this time last year. The year-to-date home sale price for the 16-county central Indiana region was $282,160 an increase of 14 percent compared to January 2021. Pended home sales decreased, down 2.1 percent compared to this time last year. Available housing inventory continued to decrease, down 14.3 percent compared to January 2021.
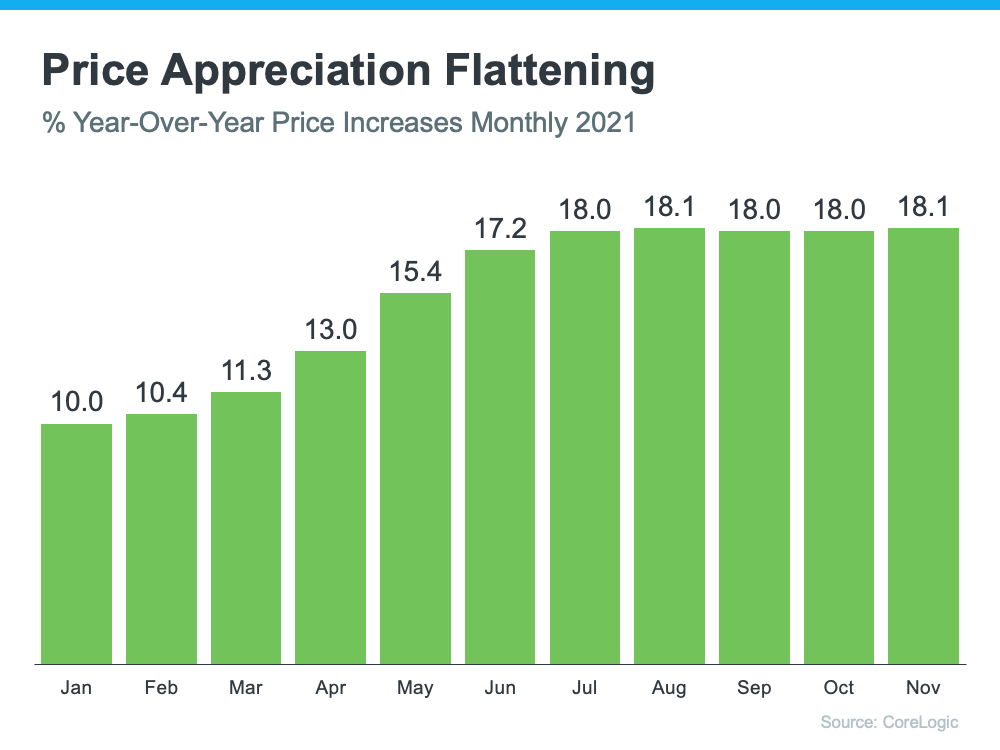
After almost two years of double-digit increases, many experts thought home price appreciation would decelerate or happen at a slower pace in the last quarter of 2021. However, the latest Home Price Insights Report from CoreLogic indicates while prices may have plateaued, appreciation has definitely not slowed. The following graph shows year-over-year appreciation throughout 2021. December data has not yet been released.
As the graph shows, appreciation has remained steady at around 18% over the last five months.
In addition, the latest S&P Case-Shiller Price Index and the FHFA Price Index show a slight deceleration from the same time last year – it’s just not at the level that was expected. However, they also both indicate there’s continued strong price growth throughout the country. FHFA reports all nine regions of the country still experienced double-digit appreciation. The Case-Shiller 20-City Index reveals all 20 metros had double-digit appreciation.
Why Haven’t We Seen the Deeper Deceleration Many Expected?
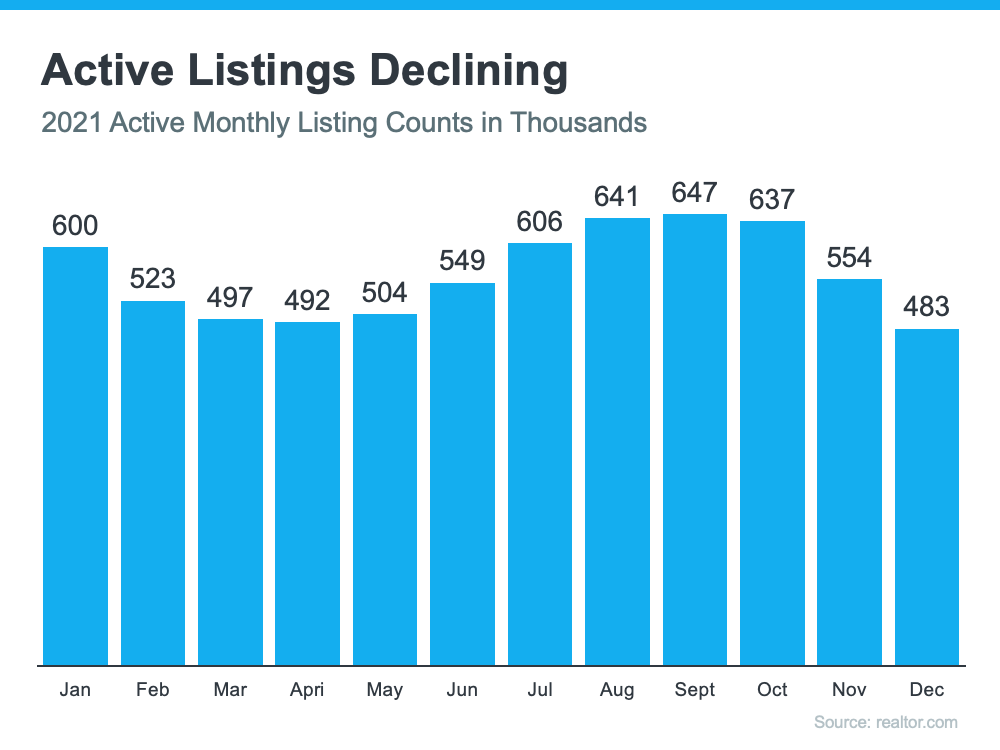
Experts had projected the supply of housing inventory would increase in the last half of 2021 and buyer demand would decrease, as it historically does later in the year. Since all pricing is subject to supply and demand, it seemed that appreciation would wane under those conditions.
Buyer demand, however, did not slow as much as expected, and the number of listings available for sale dropped instead of improved. The graph below uses data from realtor.com to show the number of available listings for sale each month, including the decline in listings at the end of the year.
Here are three reasons why the number of active listings didn’t increase as expected:
1. There hasn’t been a surge of foreclosures as the forbearance program comes to an end.
3. Many believed more sellers would put their houses on the market once the concerns about the pandemic began to ease. However, those concerns have not yet disappeared. A recent article published by com explains:
“Before the omicron variant of COVID-19 appeared on the scene, the 2021 housing market was rebounding healthily from previous waves of the pandemic and turned downright bullish as the end of the year approached. . . . And then the new omicron strain hit in November, followed by a December dip in new listings. Was this sudden drop due to omicron, or just the typical holiday season lull?”
No one knows for sure, but it does seem possible.
Bottom Line
Home price appreciation might slow (or decelerate) in 2022. However, based on supply and demand, you shouldn’t expect the deceleration to be swift or deep.
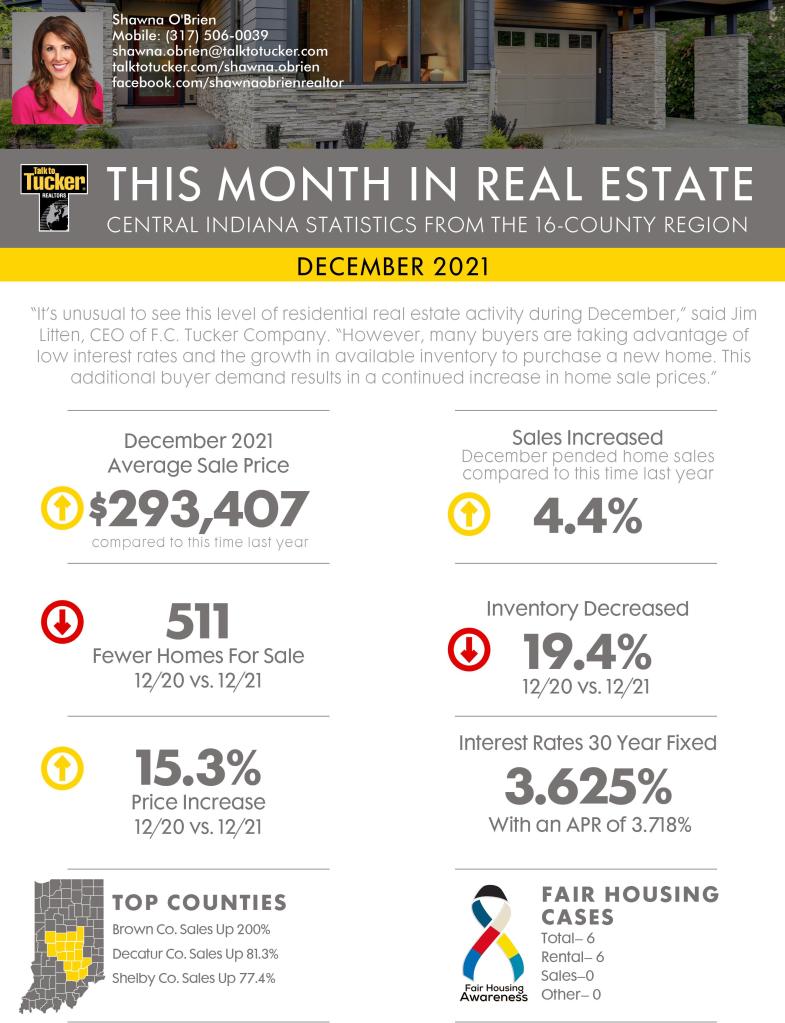
December 2021 bucked the typical trend of a quieter residential real estate market during the holidays.
Monthly real estate statistics from F.C. Tucker Company revealed that December 2021 pended home sales increased 4.4 percent compared to December 2020.
Year-to-date home sale prices increased 12.6 percent, and central Indiana housing inventory decreased 19.4 percent compared to this time last year. The average December 2021 home sale price for the 16-county central Indiana region was $293,407- an increase of 15.3 percent compared to December 2020.
When mortgage forbearance plans were first announced and the pandemic surged through the country in early 2020, many homeowners were allowed to pause their mortgage payments. Some analysts were concerned that once the forbearance program ended, the housing market would experience a wave of foreclosures like what happened after the housing bubble 15 years ago.
Here’s a look at why that isn’t the case.
1. There Are Fewer Homeowners in Trouble This Time
After the last housing crash, over nine million households lost their homes to a foreclosure, short sale, or because they gave it back to the bank. Many believed millions of homeowners would face the same fate again this time.
However, today’s data shows that most homeowners exited their forbearance plan either fully caught up on payments or with a plan from the bank that restructured their loan in a way that allowed them to start making payments again. The latest data from the Mortgage Bankers Association (MBA) studies how people exited the forbearance program from June 2020 to November 2021.
Here are those findings:
38.6% left the program paid in full
19.9% made their monthly payments during the forbearance period
16.8% left the program still in trouble and without a loss mitigation plan in place
2. Those Left in the Program Can Still Negotiate a Repayment Plan
As of last Friday, the total number of mortgages still in forbearance stood at 890,000. Those who remain in forbearance still have the chance to work out a suitable plan with the servicing company that represents their lender. And the servicing companies are under pressure to do just that by both federal and state agencies.
Rick Sharga, Executive Vice President at RealtyTrac, says in a recent tweet:
“The [Consumer Financial Protection Bureau] and state [Attorneys General] look like they’re adopting a ‘zero tolerance’ approach to mortgage servicing enforcement. Likely that this will limit #foreclosure activity for a good part of 2022, while servicers explore all possible loss [mitigation] options.”
For more information, read the warning issued by the Attorney General of New York State.
3. Most Homeowners Have More Than Enough Equity To Sell Their Homes
For those who can’t negotiate a solution and the 16.8% who left the forbearance program without a work-out, many will have enough equity to sell their homes and leave the closing with cash instead of facing foreclosures.
Due to rapidly rising home prices over the last two years, the average homeowner has gained record amounts of equity in their home. As Frank Martell, President & CEO of CoreLogic,explains:
“Not only have equity gains helped homeowners more seamlessly transition out of forbearance and avoid a distressed sale, but they’ve also enabled many to continue building their wealth.”
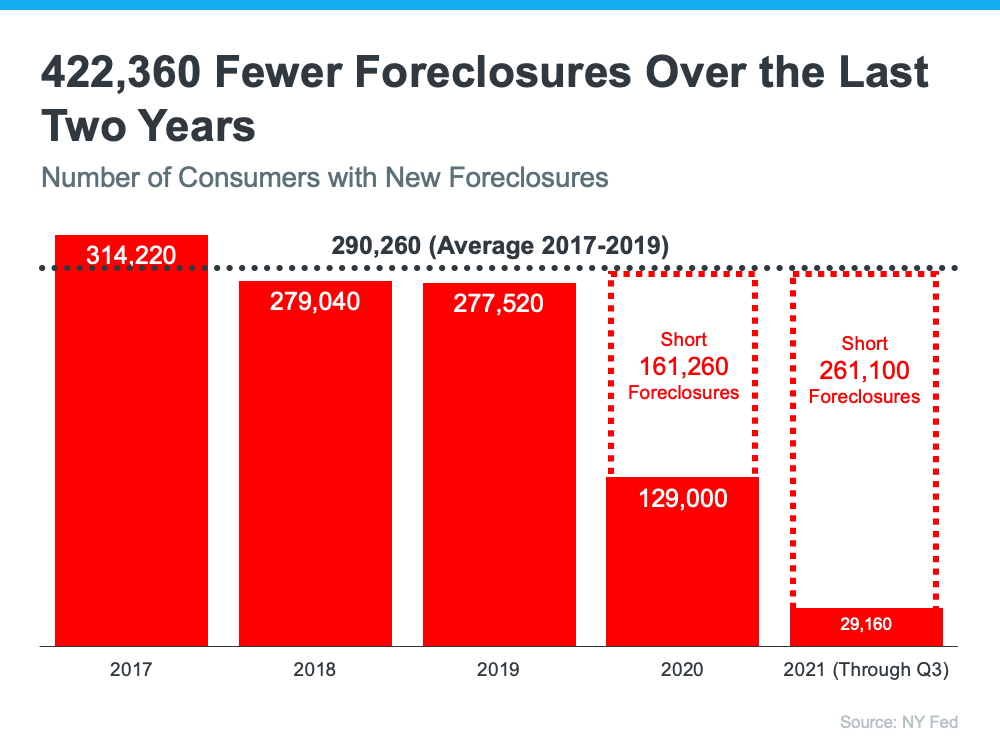
4. There Have Been Far Fewer Foreclosures Over the Last Two Years
One of the seldom-reported benefits of the forbearance program was that it allowed households experiencing financial difficulties prior to the pandemic to enter the program. It gave those homeowners an extra two years to get their finances in order and work out a plan with their lender. That prevented over 400,000 foreclosures that normally would have come to the market had the new forbearance program not been available. Otherwise, the real estate market would have had to absorb those foreclosures. Here’s a graph depicting this data:
5. The Current Market Can Easily Absorb Over a Million New Listings
When foreclosures hit the market in 2008, they added to the oversupply of houses that were already for sale. That resulted in over a nine-month supply of listings, and anything over a six-month supply can cause prices to depreciate.
It’s exactly the opposite today. The latest Existing Home Sales Report from the National Association of Realtors (NAR) reveals:
“Total housing inventory at the end of November amounted to 1.11 million units, down 9.8% from October and down 13.3% from one year ago (1.28 million). Unsold inventory sits at a 2.1-month supply at the current sales pace, a decline from both the prior month and from one year ago.”
A balanced market would have approximately a six-month supply of inventory. At 2.1 months, the market is severely understocked. Even if one million homes enter the market, there still won’t be enough inventory to meet the current demand.
Bottom Line
The end of the forbearance plan will not cause any upheaval in the housing market. Sharga puts it best:
“The fact that foreclosure starts declined despite hundreds of thousands of borrowers exiting the CARES Act mortgage forbearance program over the last few months is very encouraging. It suggests that the ‘forbearance equals foreclosure’ narrative was incorrect. . . .”
When you think of homeownership, what’s the first thing that comes to mind? Chances are you might focus on the non-financial benefits, like the security or stability a home provides. But what about equity? While it can be overlooked, a homeowner’s equity helps build long-term wealth over time. Here’s a look at what equity is and why it matters.
For a homeowner, your equity is the current value of your home minus what you owe on the loan. So, as home values climb, your equity does too. That’s exactly what’s happening today. There aren’t enough homes on the market to meet buyer demand, so bidding wars and multiple offers are driving prices up. That’s because people are willing to pay more to buy a home. Right now, this low supply and high demand are giving current homeowners a significant equity boost.
Dr. Frank Nothaft, Chief Economist at CoreLogic, explains it like this:
“Home price growth is the principal driver of home equity creation. The CoreLogic Home Price Index reported home prices were up 17.7% for the past 12 months ending September, spurring the record gains in home equity wealth.”
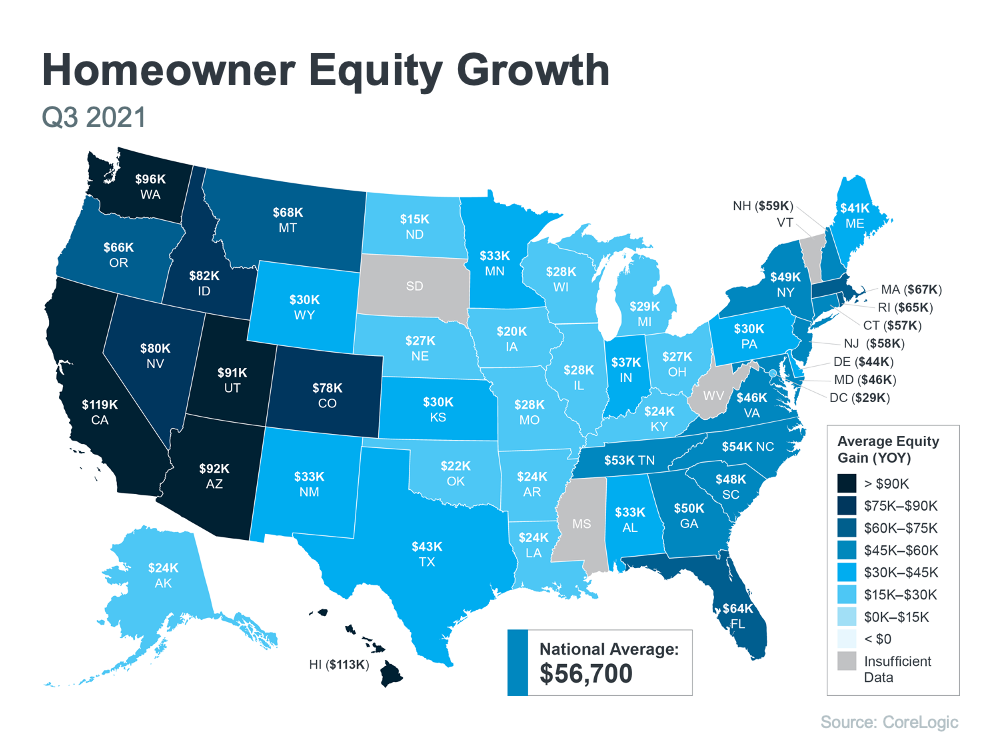
To find out just how much rising home values have impacted equity, we turn to the latest Homeowner Equity Insights from CoreLogic. According to that report, the average homeowner’s equity has grown by $56,700 over the last 12 months.
Curious how your state stacks up? Check out the map below to find out the average equity gain for your area.
How Rising Equity Impacts You
If you’re already a homeowner, equity not only builds your wealth, it also opens doors for you to achieve your goals. It works like this: when you sell your house, the equity you built up comes back to you in the sale. You can use those proceeds to fuel your next move, especially if you’ve decided your needs have changed and you’re looking for something new.
If you’re thinking about becoming a homeowner, understanding the importance of equity can help you realize why homeownership is a worthwhile goal. It builds your wealth and gives you peace of mind that your investment is a wise one, not just from a lifestyle perspective, but from a financial one too.
Bottom Line
Whether you’re a current homeowner or you’re ready to become one, it’s important to know how equity works and why it matters. If this inspires you to make a move, let’s connect to explore your options and find out what steps you need to take next.
As we move into 2022, both buyers and sellers are wondering, what’s next? Will there be more homes available to buy? Will prices keep climbing? How high will mortgage rates go? For the answer to those questions and more, we turn to the experts. Here’s a look at what they say we can expect in 2022.
Odeta Kushi, Deputy Chief Economist, First American:
“Consensus forecasts put rates at about 3.7% by the end of next year. So, that’s still historically low, but certainly higher than they are today.”
“Affordability will increasingly be a challenge as interest rates and prices rise, but remote work may expand search areas and enable younger buyers to find their first homes sooner than they might have otherwise. And with more than 45 million millennials within the prime first-time buying ages of 26-35 heading into 2022, we expect the market to remain competitive.”
Lawrence Yun, Chief Economist, National Association of Realtors (NAR):
“With more housing inventory to hit the market, the intense multiple offers will start to ease. Home prices will continue to rise but at a slower pace.”
George Ratiu, Manager of Economic Research, realtor.com:
“We also expect a growing number of homeowners to bring properties to market, taking some pressure off high prices and offering buyers more options.”
“Strong demographic demand will continue to act as the wind in the housing market’s sails.”
What Does This Mean for Buyers?
Hope is on the horizon for 2022. You should see your options grow as more homes are listed and some of the peak intensity of buyer competition starts to ease. Just remember, rising rates and prices are a great motivator for you to find the home of your dreams sooner rather than later so you can buy while today’s affordability is still in your favor.
What Does This Mean for Sellers?
Make no mistake – this sellers’ market will remain in 2022 as home prices are projected to continue climbing, just at a more moderate pace. Selling your house while buyer demand is so high will truly put you in the driver’s seat. But don’t wait too long. With more listings projected to become available, your ideal window of opportunity to stand out from the crowd won’t last forever. Work with an agent who knows your local market and current inventory conditions to ensure you have the support you need to make an educated and informed decision about selling in the coming year.
Bottom Line
If you’re thinking of buying or selling, 2022 may be your year. Let’s connect to discuss your goals and the unique opportunities you have in today’s housing market.
November saw another unusually active residential real estate market in central Indiana; home sales and prices continue to increase
While half of central Indiana counties saw housing inventory increases in November, the seller’s market continued with both home sales and home prices increasing. Monthly real estate statistics from F.C. Tucker Company revealed that November 2021 pended home sales increased 6.9 percent compared to November 2020. Year-to-date home sale prices increased 12.2 percent, and central Indiana housing inventory decreased 18.4 percent overall compared to this time last year.
• The average November 2021 home sale price for the 16-county central Indiana region was $288,685, an increase of 11.3 percent.
• Pended home sales increased, up 6.9 percent compared to this time last year.
• Available housing inventory continued to decrease, down 18.4 percent compared to November 2020.
It’s impossible to research the subject of buying a home without coming across a headline declaring that the fall in home affordability is a crisis. However, when we add context to the most recent affordability statistics, we soon realize that, though homes are less affordable than they have been over the last few years, they are more affordable than they historically have been.
Black Knight, a premier provider of data and analytics for the mortgage industry, just released their latest Monthly Mortgage Monitor which includes a new analysis of the affordability situation. Here’s what the report reveals:
“The monthly payment required to purchase the average priced home with a 20% down 30-year fixed rate mortgage increased by nearly 20% (+$210) over the first nine months of 2021, . . . It now requires 21.6% of the median household income to make the monthly mortgage payment on the average home purchase, the least affordable housing has been since 30-year rates rose to nearly 5% back in late 2018.”
Basically, the report shows that homes are less affordable today than at any other time in the last three years. However, in a previous report earlier this year, Black Knight calculated that the percentage of the median household income to make the monthly mortgage payment on the average home purchase over the last 25 years was 23.6% (see graph below):Today’s payment-to-income ratio is more affordable than the average over the last 25 years. Given that context, we can see that American households still have the same ability to be homeowners as their parents did 20 years ago.
This confirms the recent analysis of ATTOM Data resources where Todd Teta, Chief Product and Technology Officer, explains:
“The typical median-priced home around the U.S. remains affordable to workers earning an average wage, despite prices that keep going through the roof. Super-low interests and rising pay continue to be the main reasons why.”
Bottom Line
It’s true that it’s less affordable to buy a home today than it has been the last few years. However, it’s more affordable to buy today than the average over the last 25 years. In other words, homes are less affordable, but they’re not unaffordable. That’s an important distinction.